teaching technically, chapter 8, April 4th

Chapter 1 | Chapter 2 | Chapter 3 | Chapter 4| Chapter 5 | Chapter 6 | Chapter 7
In the eighth chapter of notes, I define trends. In the previous chapter, we learned that supports and resistances don't indicate reversals in trend formation. Now, we continue to look at trends, more in depth.
A trend, once established, is more likely to continue than it is to reverse.
This information alone speaks largely to the recent market performance of crypto as a whole- but before we discuss that, let's discuss trends.
As we discussed in previous chapters, uptrends are defined by higher highs and higher lows, while downtrends are marked by lower highs and lower lows.
However, the above conclusions omit timeframes. Without this frame of reference, findings are arbitrary.
Shannon defines long-term investors as individuals mostly occupied with the monthly and weekly windows. Those prove most relevant to that individual trader. Day traders, by contrast, would only find the past day to five days to be relevant.
The highest-estimated probability trades, therefore, exist along the alignment of multiple timeframes.
In fact, we can observe the following two qualities:
- longer term trends are more powerful, exerting force
- shorter term corrections within the longer time-frame resolve in the direction of the long-term
These notes specifically help those aiming to be a day trader. Brian Shannon likes to trade in what he describes as the primary trend. For example, a short term trader, one of 1 to 10 days, recognizes the day frame as the primary trend.
In addition, a piece of logic he holds contributes to the ease of investing with the direction of the trend in markets.
The sum of the rallies will always be greater than the sum of the declines in an uptrend.
In other words, despite pullbacks, within an uptrend, the total amount of positive gains always dwarfs the total amount of negative losses. One, in a manner of speaking, could buy assets and "chill."
Additional information adds clarity to these market structures. The larger the volume on a major break of consolidation levels, the greater odds of a new trend to sustain the move.
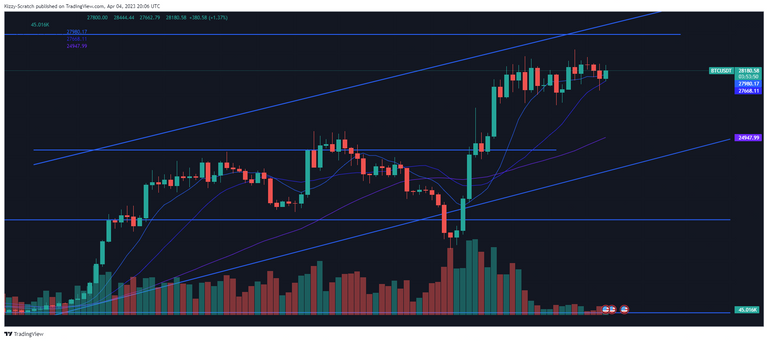
In recent weeks, individuals stood stunned at the sight of Bitcoin rising amidst negative news and fears of banking crises. Watchers of the chart might've noted instead, that a volume of about 600 thousand BTC exchanged to buyers, holding that the price might remain elevated and upwards for another extended period, with which participants find themselves at the moment.
Trendlines
Shannon makes a comment here that some unfamiliar to the practice of technical analysis might not understand.
'Trendlines are drawn with crayon, not with a ruler and pencil'
The meaning to catch might suggest, trendlines are imprecise by design and only meant to designate areas rather than hard prices.
In addition, he adds the touching of trendlines doesn't invalidate buying or selling. Rather, the touch indicates a point in which traders might further inspect the shorter time frames for opportunities to enter or exit.
In fact, touching trendlines only suggests that the rate of change slowed. More than likely, the assets may experience a time correction.
Corrections over time are one of two ways trends correct, the other being price. The formation of new supports and resistances are an instance of time corrections. By contrast, a price correction might entail a sudden decrease in price within a single unit of time- whether that be day, hour or week.
Making Cents of the Learning
The discussion of trends brings to attention a reflection on last quarter's asset prices. Using a smartphone app and the YTD strata, one could compare to the benchmark assets of crypto, BTC and ETH, to determine whether a pick makes a worthy candidate for investment during this bull cycle.
The following include some holdings this author may possess:
- BTC +70%
- ETH +56%
- MATIC +50%
- HIVE +58%
- LQTY +324%
- ANKR +130%
- MAGIC +178%
- ARB (released too recently)
- NEXO +1% (0.97%)
With the largest bastion of the market up about 70% YTD, one can then gauge the profitability of holding their assets. Here, participants might feel emotions that conflict with proper execution.
- Endowment bias might make holders feel 'married' to their bags, preventing them from exchanging assets for more profitable positions.
- Authority bias might make others feel confident in their holdings, despite their performance.
- Saliency bias might work against individuals who feel a need to switch tokens often, rather than play patient with their entries and profit from their exits.
Rather than let emotions take over, a successful trader must maintain contingencies for both negative and positive outcomes.
Opportunity Knocks
A position of 1,000 dollars in Bitcoin at the beginning of the year grew 70% to 1700$. With that kind of appreciation, the American dream of clearing debts doesn't feel farfetched. In fact, in 2021, the average credit card debt of Americans aged 35 and under amounted to 3,660 U.S. dollars.
Politicians push back, but holding tokens doesn't feel as dangerous as the equities tied to the recent banking crisis. Concerns over recession and inflation shouldn't weigh as much as the potential to clear one's name. Sadly, emotions cloud processes that truly require diligence and patience.